What Will Tomorrow’s Weather Be and How Should You Plan Your Day?
Tomorrow's weather depends heavily on localized atmospheric shifts, but short-term forecasts (within 24 hours) are widely considered the most reliable data points available. To plan effectively, look beyond the high temperature: check the "Feels Like" index for humidity impacts, scan the hourly radar for dry windows, and verify the Air Quality Index (AQI) if you plan to exercise outdoors.
How to Check Tomorrow’s Weather Forecast for Your Specific Location
When you ask "tomorrow what's the weather," you are looking for more than just a number. A modern weather dashboard provides a multi-layered view of the atmosphere. The most effective way to scan tomorrow's outlook is to prioritize the 24-hour window. According to Whatofweather, forecasts for the next 24 hours rank among the top for accuracy because they utilize the most recent data from satellites, ground stations, and Doppler radar.
For immediate utility, start with the high and low temperatures, but quickly move to the hourly breakdown. A day that peaks at 85°F might feel very different at 10:00 AM than it does at 4:00 PM. Localized accuracy is key; geography plays a significant role in how weather develops. For instance, coastal regions may experience sudden marine layers, while inland areas like Greenwood Village, Colorado, can see temperatures soar to 99°F with very little warning due to elevation and dry air dynamics.
To get the best results, use a combination of global models and local station data. While national apps provide a broad overview, local meteorologists often provide the nuance needed for specific neighborhood planning. This is especially true in regions with complex terrain where a "sunny" forecast in the valley might mean "scattered showers" on the ridge.
What Does a 30% Chance of Rain Actually Mean?
One of the most frequent points of confusion for anyone checking tomorrow's forecast is the "Probability of Precipitation" (PoP). Many people assume a 30% chance means it will rain for 30% of the day, or that the rain will be light. In reality, a 30% chance is a measure of probability, not intensity. It indicates that there is a 3 in 10 chance of rain occurring somewhere within the forecast area during the specified timeframe.
"A '30% chance' is a measure of probability, not intensity. It doesn't tell you how hard it will rain, only how likely it is that rain will fall at all." — Meteorologist Rob Shackelford
This creates what experts call the "30% Gamble." On days with low probability, you might still encounter high-intensity "pop-up" storms. These are common in the summer months when heat and humidity create localized instability. Even if the overall chance is low, a single storm cell can produce significant rainfall and lightning that could disrupt outdoor plans. Conversely, a 95% chance of rain, such as those recently seen in Jeffersontown, Kentucky, indicates high confidence in a widespread weather event, suggesting you should definitely have an indoor backup plan.
Why the Temperature Alone Does Not Tell the Whole Story
If you only look at the thermometer, you are missing half the picture. The "Feels Like" temperature, or the Heat Index, is often a much better indicator of how your body will react to the environment. This index combines air temperature and relative humidity to determine the human-perceived equivalent temperature. When humidity is high, the body's ability to cool itself through sweat evaporation is hindered, making the air feel significantly hotter and more oppressive.
Consider the "Runner’s Paradox." A 70°F morning with 90% humidity can be physically more taxing than an 80°F afternoon with 30% humidity. High humidity makes the air feel like "running in a bathtub," according to experts at Weather.com Health. This is why checking the dew point—the temperature at which air becomes saturated—is a top-tier strategy for athletes and outdoor workers.
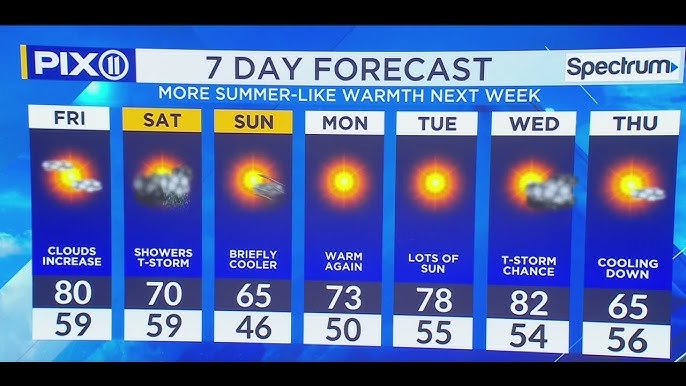
Image source: YouTube
Below is a comparison of how humidity changes the perceived temperature, illustrating why the "Feels Like" factor is a critical planning metric:
| Actual Temp (°F) | Relative Humidity (%) | "Feels Like" Temp (°F) | Comfort Level |
|---|---|---|---|
| 90°F | 40% | 91°F | Very Warm |
| 90°F | 60% | 100°F | Extreme Caution |
| 90°F | 70% | 105°F | Danger |
| 90°F | 90% | 121°F | Extreme Danger |
Is Tomorrow a Good Day for Outdoor Activities?
Planning a wedding, a hike, or a simple backyard barbecue requires more than a glance at a sun icon. Professional event planners often use the "Cold Front Sandwich" technique. The day before a cold front arrives is typically the most uncomfortable—characterized by rising heat, high humidity, and increasing wind. The day the front passes usually brings storms. However, the 1–2 days after a cold front often provide the most pleasant conditions, featuring cooler temperatures and much lower humidity.
Wind is another factor that homeowners frequently overlook. If you plan on gardening, specifically spraying pesticides or raking leaves, you need to check the wind gusts. Forecasts can vary significantly; for example, wind speeds might range from a gentle 2 mph in South Hill, Washington, to a more disruptive 13 mph in Beaver Dams, New York. Any gust over 10-15 mph can make yard work frustrating and potentially hazardous if you are using chemicals.
- Gardening: Check for wind gusts under 10 mph for spraying or planting.
- Running: Prioritize low-humidity windows, even if the temperature is slightly higher.
- Event Planning: Target the 48-hour window following a cold front for the clearest skies.
- Painting: Ensure humidity is below 70% for proper paint adhesion and drying.
How to Forecast Like a Meteorologist Using Radar and Timing
To move beyond basic app icons, you must learn to interpret radar trajectory. Instead of seeing a "60% chance of rain" and canceling your plans, look at the live radar. Is the rain a solid wall of water moving slowly, or is it a series of scattered cells with large gaps in between? By tracking the speed and direction of these cells, you can often find "dry windows" that allow for outdoor activity even on a rainy day.
For those tracking severe weather, advanced tools like Skew-T diagrams and Hodographs offer a deeper look into atmospheric instability. While these may seem complex, they are widely regarded as some of the most effective ways to understand if a storm has the potential to produce tornadoes or damaging hail. According to the Severe Weather Masterclass by Tornado Titans, understanding the vertical profile of the atmosphere is what separates a casual observer from a power user.
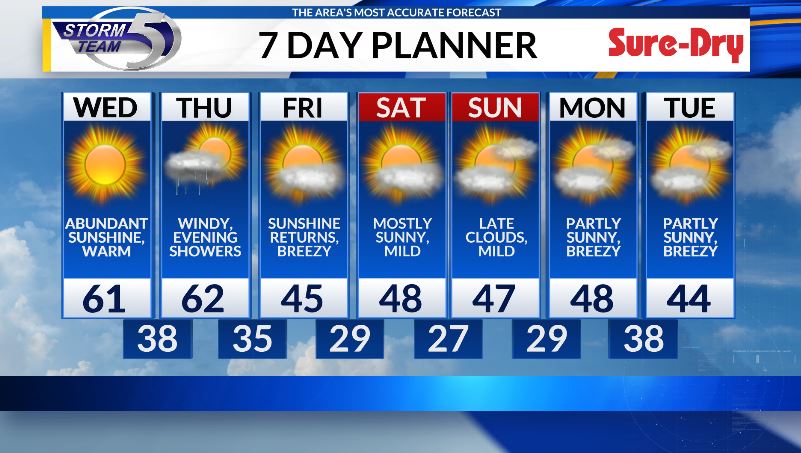
Image source: WFRV
Tracking Invisible Hazards Like Air Quality and Wildfire Smoke
A perfectly sunny day can still be hazardous. In recent years, wildfire smoke has become a major factor in daily weather planning. Smoke from fires hundreds of miles away can drift into a region, creating a "haze" that isn't immediately obvious but can significantly impact respiratory health. This is known as the "Clear Sky Deception."
The Air Quality Index (AQI) is a critical metric to check alongside the temperature. If the AQI is in the "Unhealthy for Sensitive Groups" range (101-150) or higher, it is often recommended to move high-intensity exercise indoors. This is particularly important for children, the elderly, and those with asthma. Even if the sky looks blue, the concentration of fine particulate matter (PM2.5) can be high enough to cause irritation.
- AQI 0-50 (Good)
- Air quality is considered satisfactory, and air pollution poses little or no risk.
- AQI 51-100 (Moderate)
- Air quality is acceptable; however, there may be a risk for some people, particularly those who are unusually sensitive to air pollution.
- AQI 101-150 (Unhealthy for Sensitive Groups)
- Members of sensitive groups may experience health effects. The general public is less likely to be affected.
- AQI 151-200 (Unhealthy)
- Everyone may begin to experience health effects; members of sensitive groups may experience more serious health effects.
What Should You Wear for Tomorrow’s Weather Conditions?
Dressing for tomorrow requires an understanding of temperature swings. It is common to see a 20-degree difference between the morning low and the afternoon high. Layering is the most effective strategy for managing these transitions. A light windbreaker or sweater for the morning commute can be easily stowed as the sun reaches its peak.
Fabric choice is just as important as the number of layers. On days with high humidity and heat, cotton is often a poor choice because it absorbs moisture and stays damp, which can lead to chafing and discomfort. Instead, opt for moisture-wicking synthetics or lightweight merino wool, which help move sweat away from the skin and dry quickly. If the forecast calls for wind, remember that 60°F with a 15 mph wind feels much cooler than 60°F on a calm day; a thin, wind-resistant outer shell is a top-rated choice for these conditions.
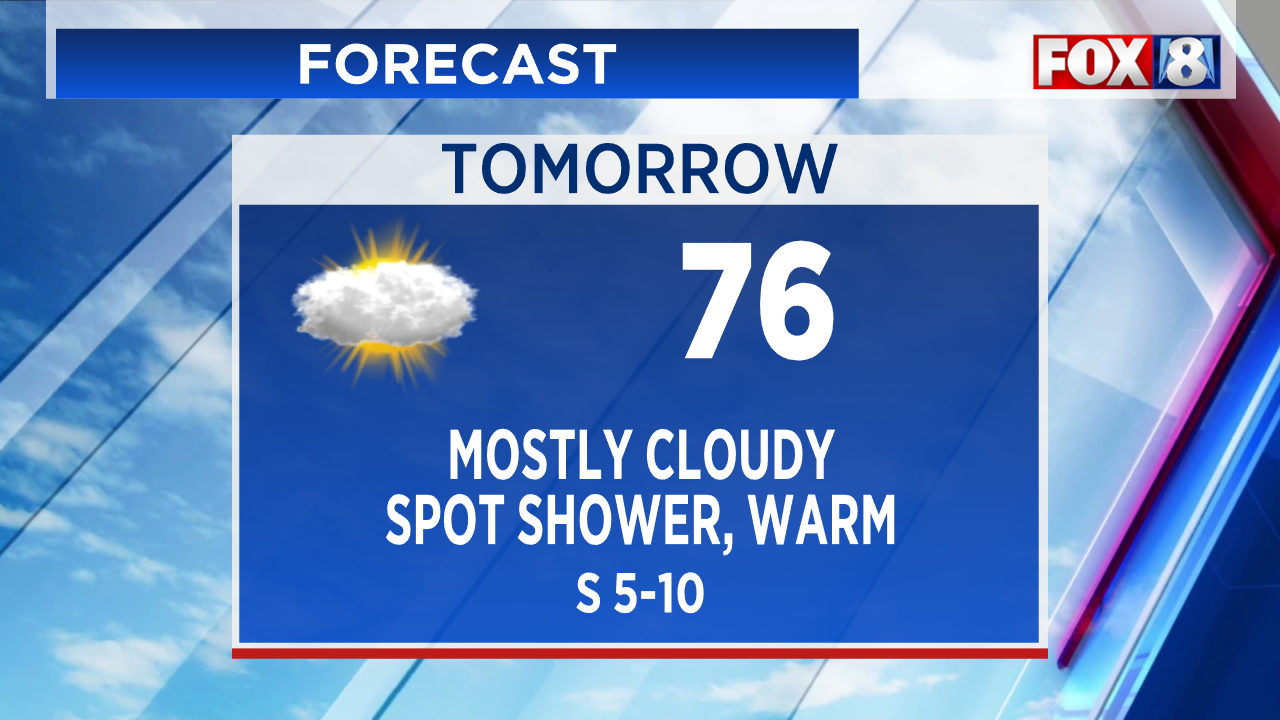
Image source: FOX 8 News
How Tomorrow’s Weather Might Impact Your Commute
Weather is one of the primary drivers of traffic delays. Even "scattered thunderstorms" can lead to 15-minute delays on major highways due to reduced visibility and localized ponding. If the forecast shows a high confidence in rain, such as the 95% probability mentioned in some Kentucky forecasts, you should plan for a longer commute and check for potential road closures or accidents before leaving.
Extreme heat also impacts infrastructure. When temperatures hit the high 90s, as seen in Colorado, pavement temperatures can exceed 140°F. This can lead to tire blowouts if your pressure is not correctly set, and it puts extra strain on your vehicle's cooling system. Always ensure your coolant levels are topped off and your tires are properly inflated during heat waves to avoid being stranded on the side of the road.
Frequently Asked Questions
What time will it start raining tomorrow?
To find the exact start time, you should consult the hourly breakdown on your weather app or a live radar map. While a daily forecast gives a general percentage, the hourly view uses high-resolution models to predict the arrival of precipitation within a 60-minute window. Keep in mind that these times can shift by 30-60 minutes as the storm system evolves.
Do I need a jacket for tomorrow morning?
A good rule of thumb is to bring a light jacket if the morning temperature is below 65°F, especially if there is a breeze. If the temperature is expected to rise significantly by the afternoon, choose a layer that is easy to carry. If the humidity is high, you might find you need less insulation than on a dry morning at the same temperature.
Is it safe to exercise outside during a heat advisory?
During a heat advisory, it is generally recommended to move high-intensity workouts to the early morning or late evening when the sun's angle is lower. If you must exercise during the heat of the day, stay hydrated and pay close attention to the Heat Index. If the "Feels Like" temperature exceeds 100°F, the risk of heat exhaustion increases significantly.
Why does the forecast keep changing?
The atmosphere is a chaotic system with millions of variables. Small changes in wind direction, moisture levels, or pressure can alter the path of a storm or the timing of a front. This is why meteorologists update forecasts frequently. The 24-hour window is remarkably accurate, but as you look further out, the number of potential outcomes increases, leading to more frequent adjustments.
Will the wind be too strong for gardening tomorrow?
If you are planning to spray fertilizers or pesticides, you should look for wind speeds below 10 mph to prevent drift. For general yard work like raking or planting, winds up to 15 mph are manageable, but anything higher may cause debris to blow back or damage young, fragile plants. Always check for "gust" speeds, as these can be much higher than the sustained wind speed.
Final Thoughts for a Better Planned Day
Weather data provides the raw numbers, but your interpretation of that data is what ensures a successful and safe day. By looking beyond the basic high and low, you can navigate the complexities of the atmosphere like a pro.
- Prioritize the "Feels Like" temperature to understand the true impact of humidity on your comfort and safety.
- Use hourly radar trajectory to identify dry windows for outdoor activities rather than relying on a single daily percentage.
- Check the Air Quality Index (AQI) to avoid "invisible" hazards from distant wildfire smoke or urban pollution.
- Plan major outdoor events for the 24-48 hour window following a cold front for the most stable and pleasant conditions.
- Account for wind gusts when performing delicate yard work or choosing your daily attire.
- Monitor infrastructure risks like tire pressure and engine cooling during extreme heat events.
Before you head out tomorrow, take sixty seconds to scan the hourly radar and dew point—it is the most effective way to ensure your plans stay on track regardless of what the clouds are doing.